
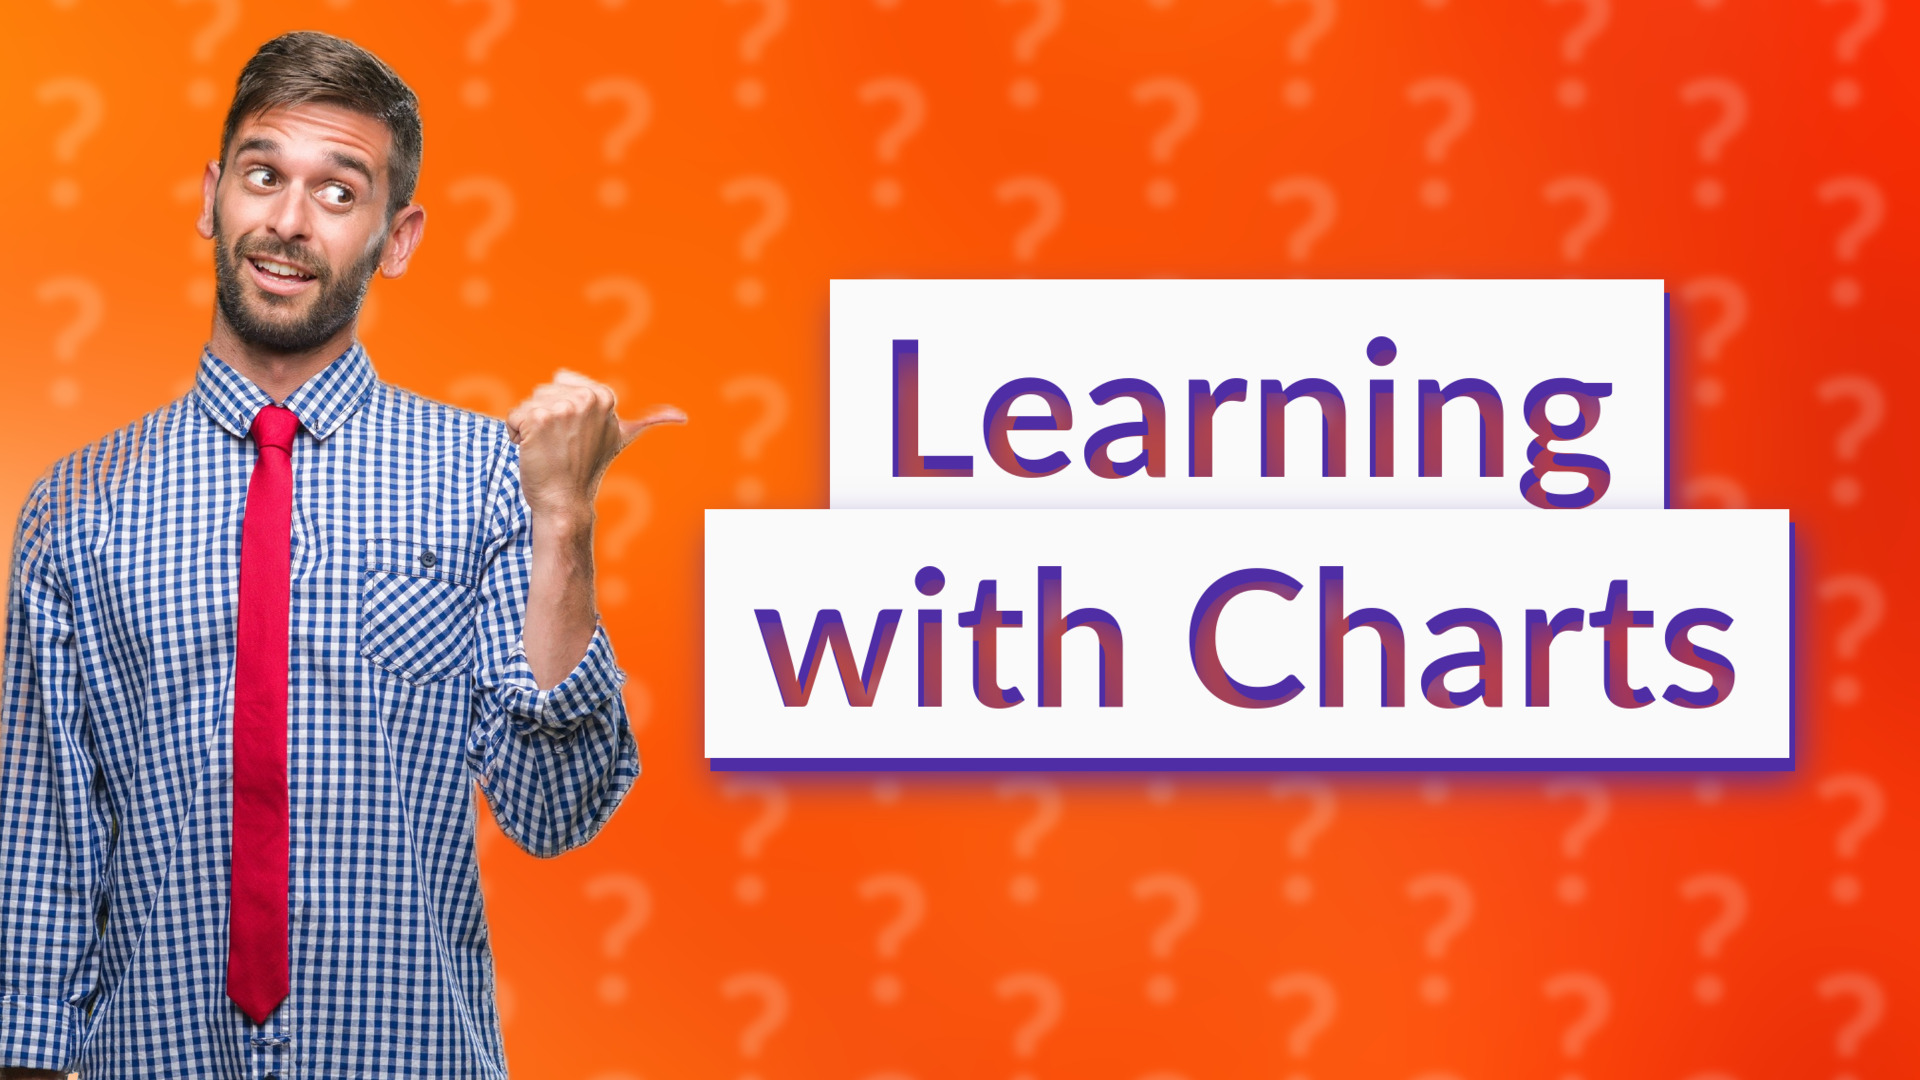
Discover how anchor charts boost student engagement and support visual learning by reinforcing key concepts and promoting independence.

Learn the key differences between posters and anchor charts in classrooms, including their uses, creation, and impact on student learning.

Explore why teachers dislike Photomath and its impact on learning math concepts and critical thinking skills.

Learn about specific word reading difficulties, commonly called dyslexia, and effective early interventions to improve reading skills.

Discover why students use Photomath to simplify math problems with step-by-step solutions for better learning and exam prep.

Learn the basics of mean and standard deviation, key concepts in statistics and probability for data analysis and variability measurement.

Discover what a phonics checklist is and how it helps educators track students' progress in essential reading skills.

Discover how text anchor charts support student learning by providing key information and strategies to enhance reading and writing skills.
Discover when word problems are introduced in school and how they develop students' math and critical thinking skills starting from early grades.

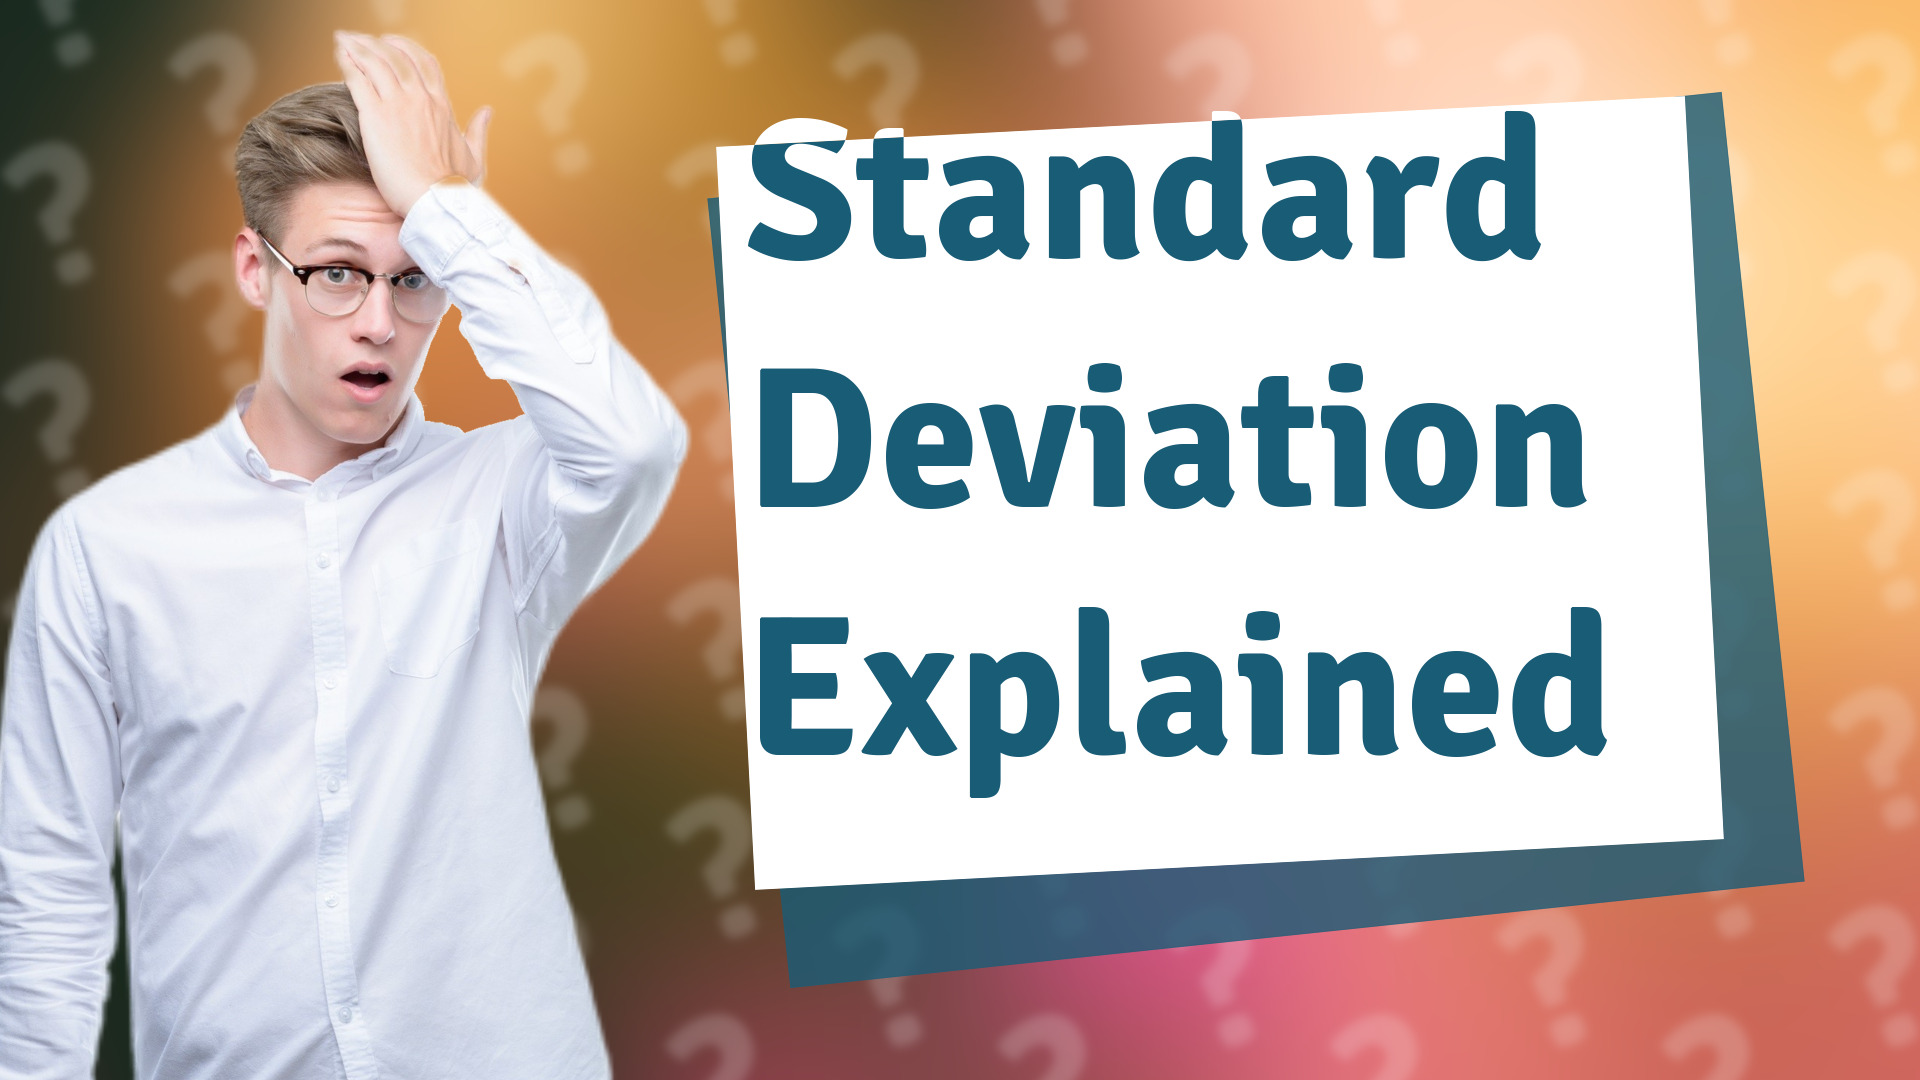
Learn what standard deviation is, how it shows data variation, and why it's vital for analyzing data spread and making decisions.

Learn step-by-step strategies to quickly solve word problems by identifying key info, breaking down steps, using diagrams, and practicing regularly.

Learn the subtle difference between reserve and substitute with clear examples and usage to avoid confusion in everyday and professional contexts.
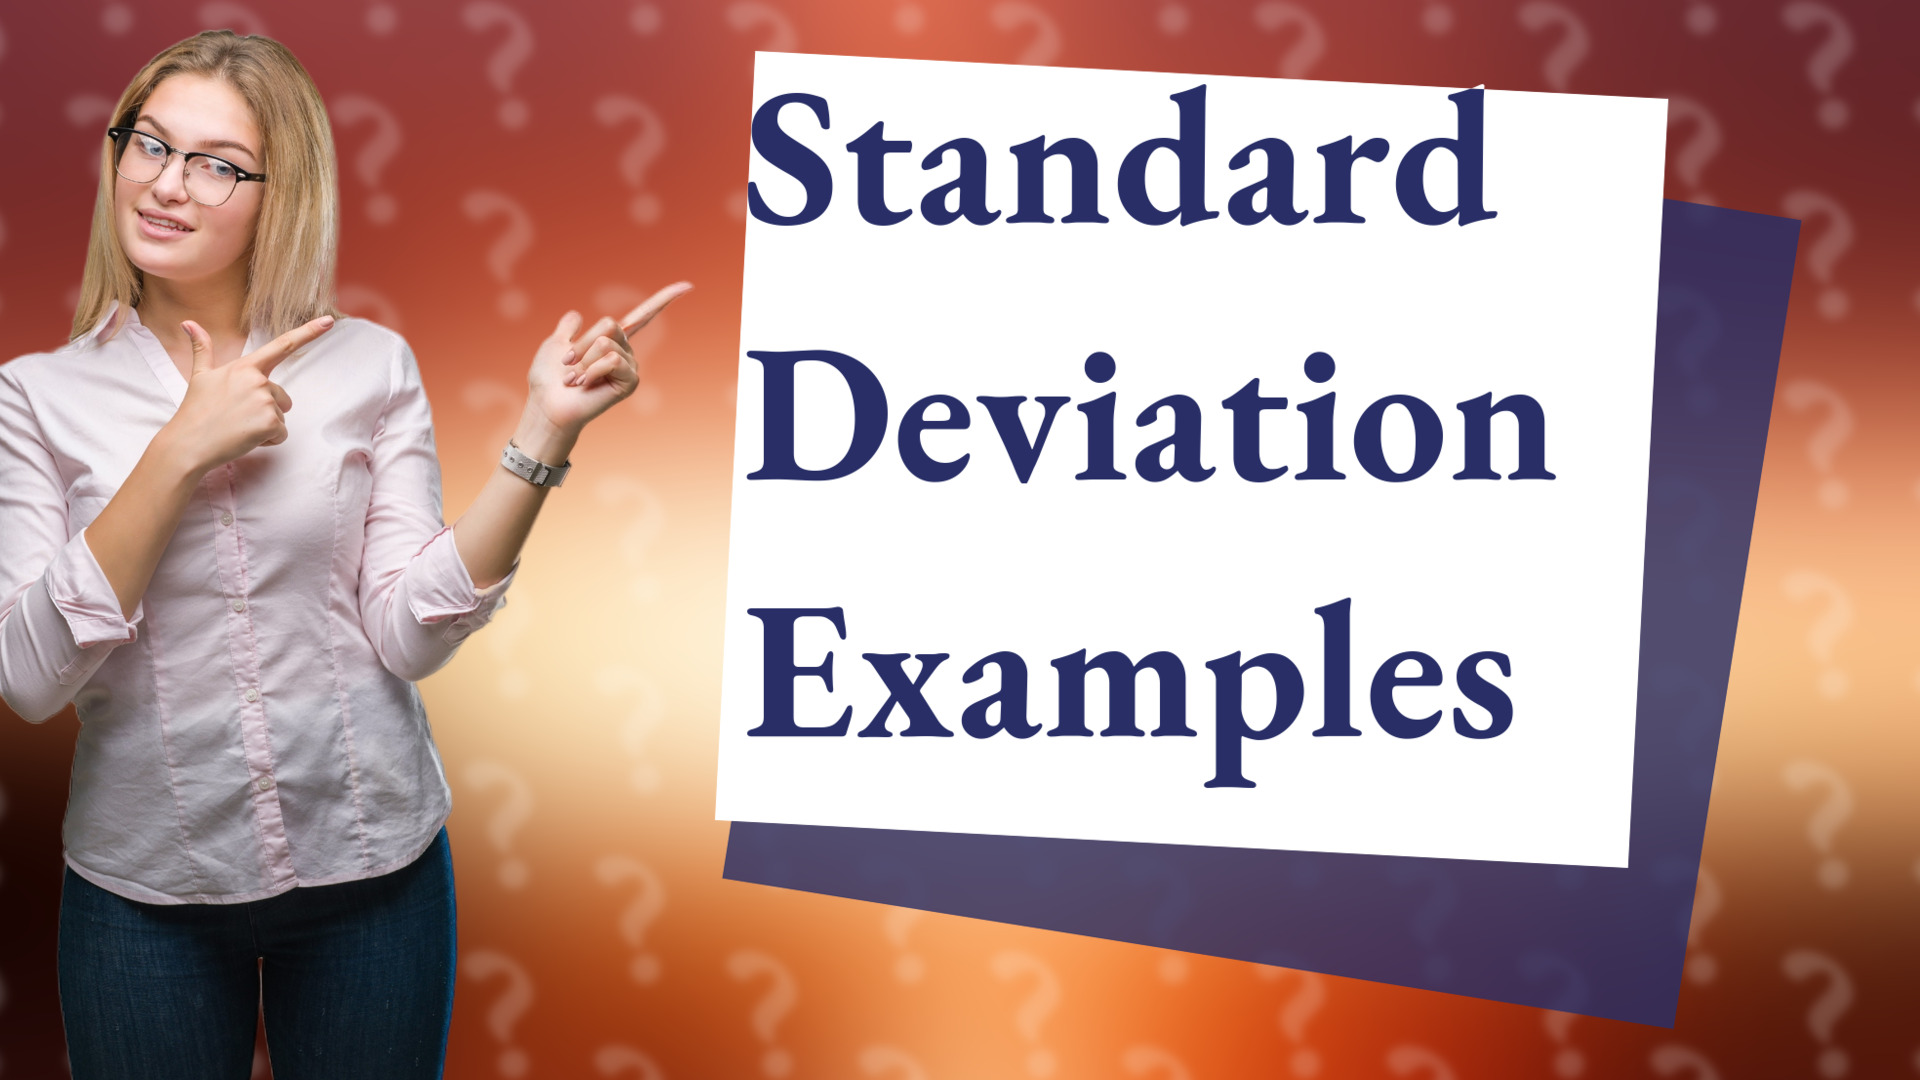
Learn what standard deviation means with a simple example illustrating data variation and how it measures dispersion around an average.

Discover the three main types of anchor charts—graphic organizer, procedure, and topic-specific—and how they enhance learning.
Discover the main disadvantage of Photomath: promoting dependency that may hinder true math comprehension and learning.

Discover why categorizing words is vital for vocabulary, comprehension, and effective learning strategies in language development.

Discover what a standard deviation of 1 means, indicating low variability and data consistency in statistics and quality control contexts.

Discover the main types of anchor charts—procedural, strategy, conceptual, and organizer—and how they enhance classroom learning.

Learn how to understand dimensions including length, width, height, and time as the fourth dimension in physics.

Learn when using Mathway is considered cheating and how to responsibly use it to enhance your math learning without compromising integrity.

Learn about the 7 essential types of measurement: Length, Volume, Mass, Time, Temperature, Electric Current, and Luminous Intensity.

Discover why word problems are challenging and learn effective strategies to solve them confidently and accurately.

Discover the drawbacks of Photomath, including how it may impact learning and its limitations with complex math problems.

Discover the essential elements of a great anchor chart that is engaging, clear, and effective for learning and reference.

Discover the three types of anchor charts—Process, Strategy, and Content—and their role in improving student learning and retention.

Discover the 21st century numeracy model focused on real-world math skills, critical thinking, and digital literacy for effective decision-making.
Learn how standard deviation measures data spread and variability in an easy, practical way with clear examples.

Learn the difference between depth and height, including clear examples to understand how they are measured differently in various objects.

Discover Indian math known as Vedic Mathematics, an ancient system from the Vedas for fast and efficient mental calculations.
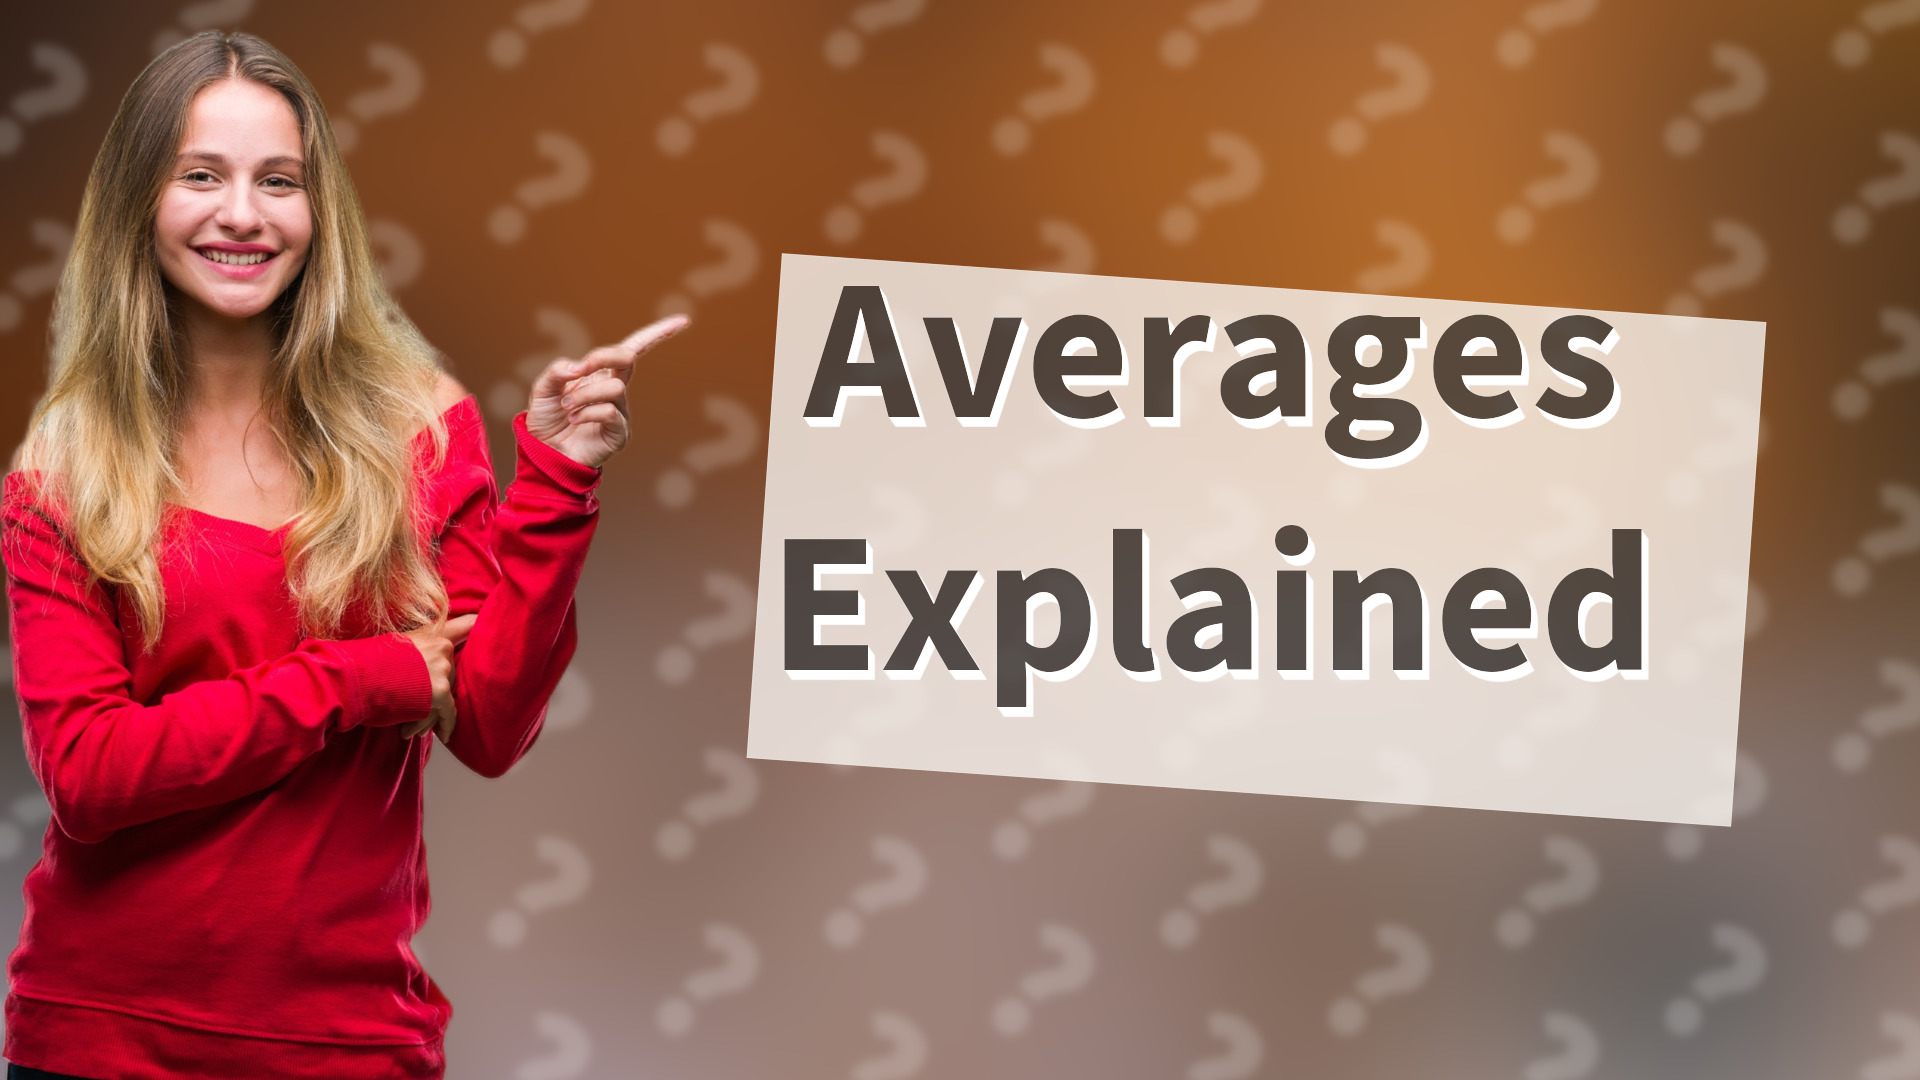
Learn the definitions and differences between mean, median, and mode, the three key averages in statistics.

Learn how standard deviation measures the spread of data around the mean with simple examples for better understanding.

Learn 3 proven techniques to solve word problems efficiently: understanding the problem, planning a strategy, and reviewing the solution.
Learn the straightforward steps to calculate standard deviation and understand data dispersion easily with this simple method.

Learn about the two types of duration: fixed duration, which remains constant, and variable duration, which changes over time.

Learn what a cultural practice PDF is and how it helps preserve and share traditional customs, rituals, and cultural knowledge.
Learn what spin means in simple terms with an easy example of a spinning top, illustrating rapid rotation around an axis.

Learn how to find the standard deviation of a group of data items with this easy step-by-step explanation.

Learn what SQ3R stands for and how this effective study method improves comprehension and retention of information.
Learn how standard deviation measures spread in real-life data with an example of student test scores showing performance variation.

Learn effective strategies to solve jumbled paragraphs by identifying topic sentences and arranging ideas logically for smooth reading.

Learn why anchor charts are effective visual tools that help students understand and remember key classroom concepts.
Learn how to easily explain standard deviation to parents using relatable examples for better understanding of data variability.

Discover why people read anchor charts and how these visual aids enhance learning, memory, and engagement in educational settings.

Learn what a slippery slope fallacy is with a clear example, definition, and why this argument is often criticized for lacking evidence.
Learn what standard deviation means with easy-to-understand examples showing low and high variation in test scores.

Learn what a high standard deviation (STDEV) indicates and how it reflects variability in your dataset with simple examples.

Discover the 3 tiers of vocabulary—basic, high-frequency, and domain-specific—and learn how they enhance language instruction.
Learn the simple difference between prejudice and discrimination and how unfair treatment arises from biased opinions.

Discover the three types of vocabulary—Tier 1, Tier 2, and Tier 3—and their roles in everyday language, academics, and specialized fields.
Discover key 2nd grade math topics including addition, subtraction, place value, shapes, and basic problem-solving skills.

Learn what standard deviation is with a clear example using test scores to understand variation and dispersion in statistics.

Learn what faulty logic is and see a clear example of the straw man fallacy in everyday arguments.

Discover the key differences between A2 and B1 language proficiency levels and understand what each means in language learning contexts.

Learn the three main purposes of theory: to explain phenomena, predict outcomes, and provide practical solutions for real-world problems.

Discover why anchor charts are named so and how they support student learning by anchoring key information visually.
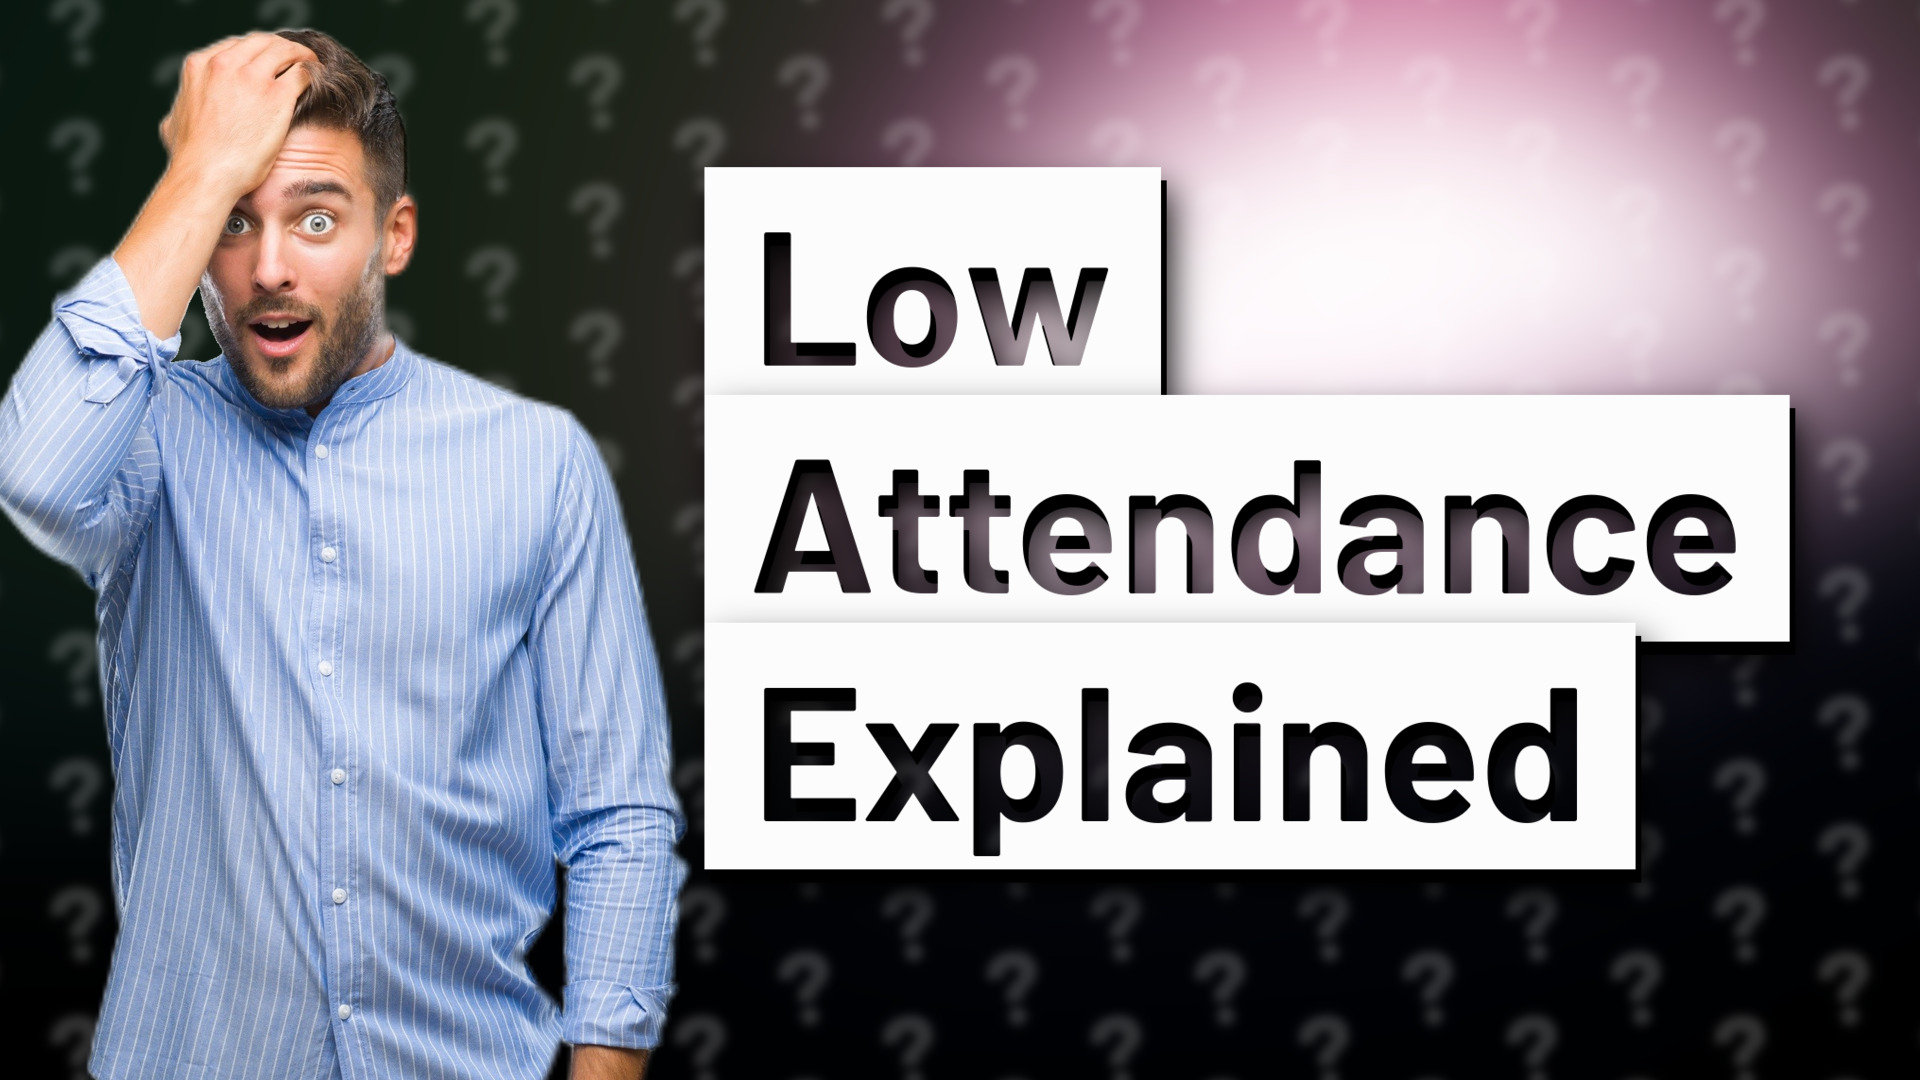
Discover what qualifies as low attendance in schools and events, including common benchmarks and their implications.

Learn the key differences between stable and unstable objects based on center of gravity and base width for better stability.

Discover the 12 key academic words that enhance comprehension and academic writing skills in scholarly texts.
Discover how anchor charts enhance learning by reinforcing key concepts and engaging students in both classroom and remote settings.

Discover how Symbolab handles calculus problems with step-by-step solutions for differentiation, integration, limits, and more.

Explore the key differences between genius and brilliant, and which signifies higher intellectual ability.

Discover how to choose the best calculator for basic arithmetic, high school, or advanced math with top models like TI-84 and Casio fx-991EX.
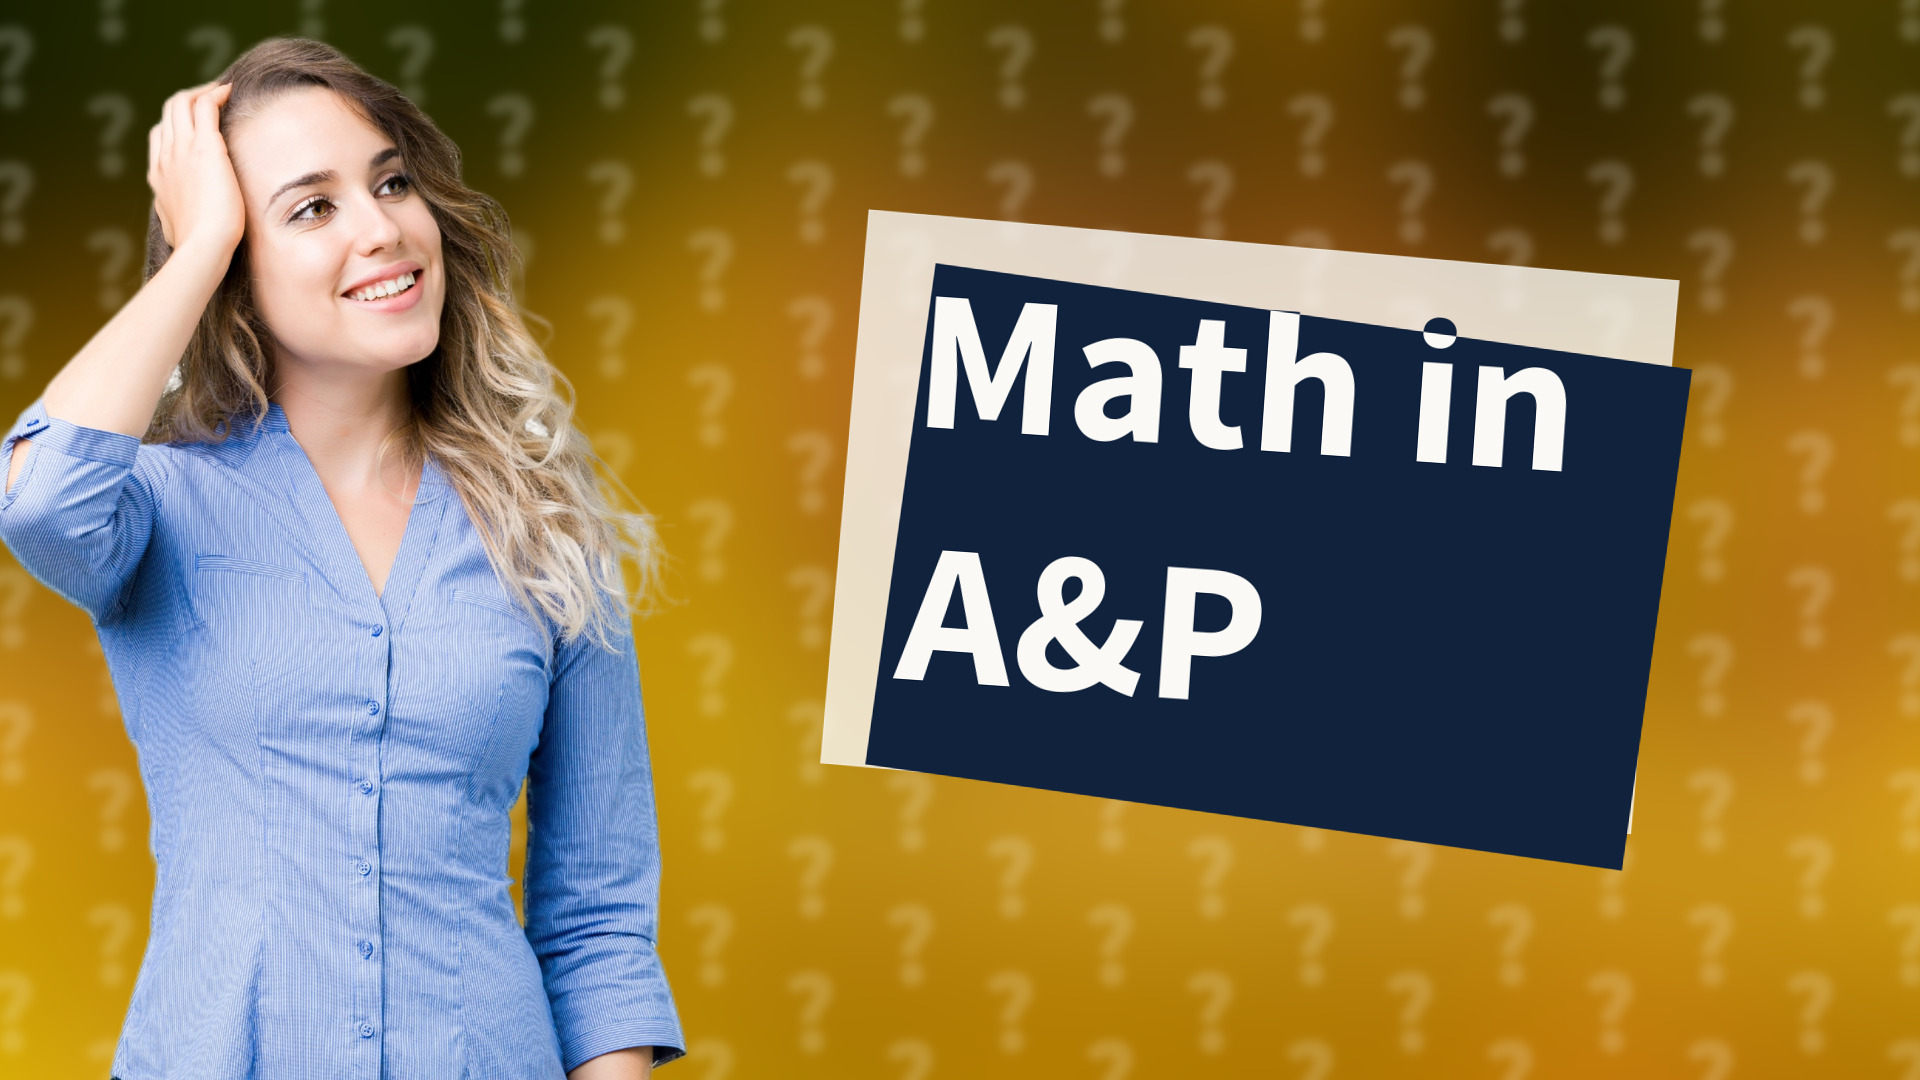
Discover how much math is involved in anatomy and physiology and tips to manage it effectively.
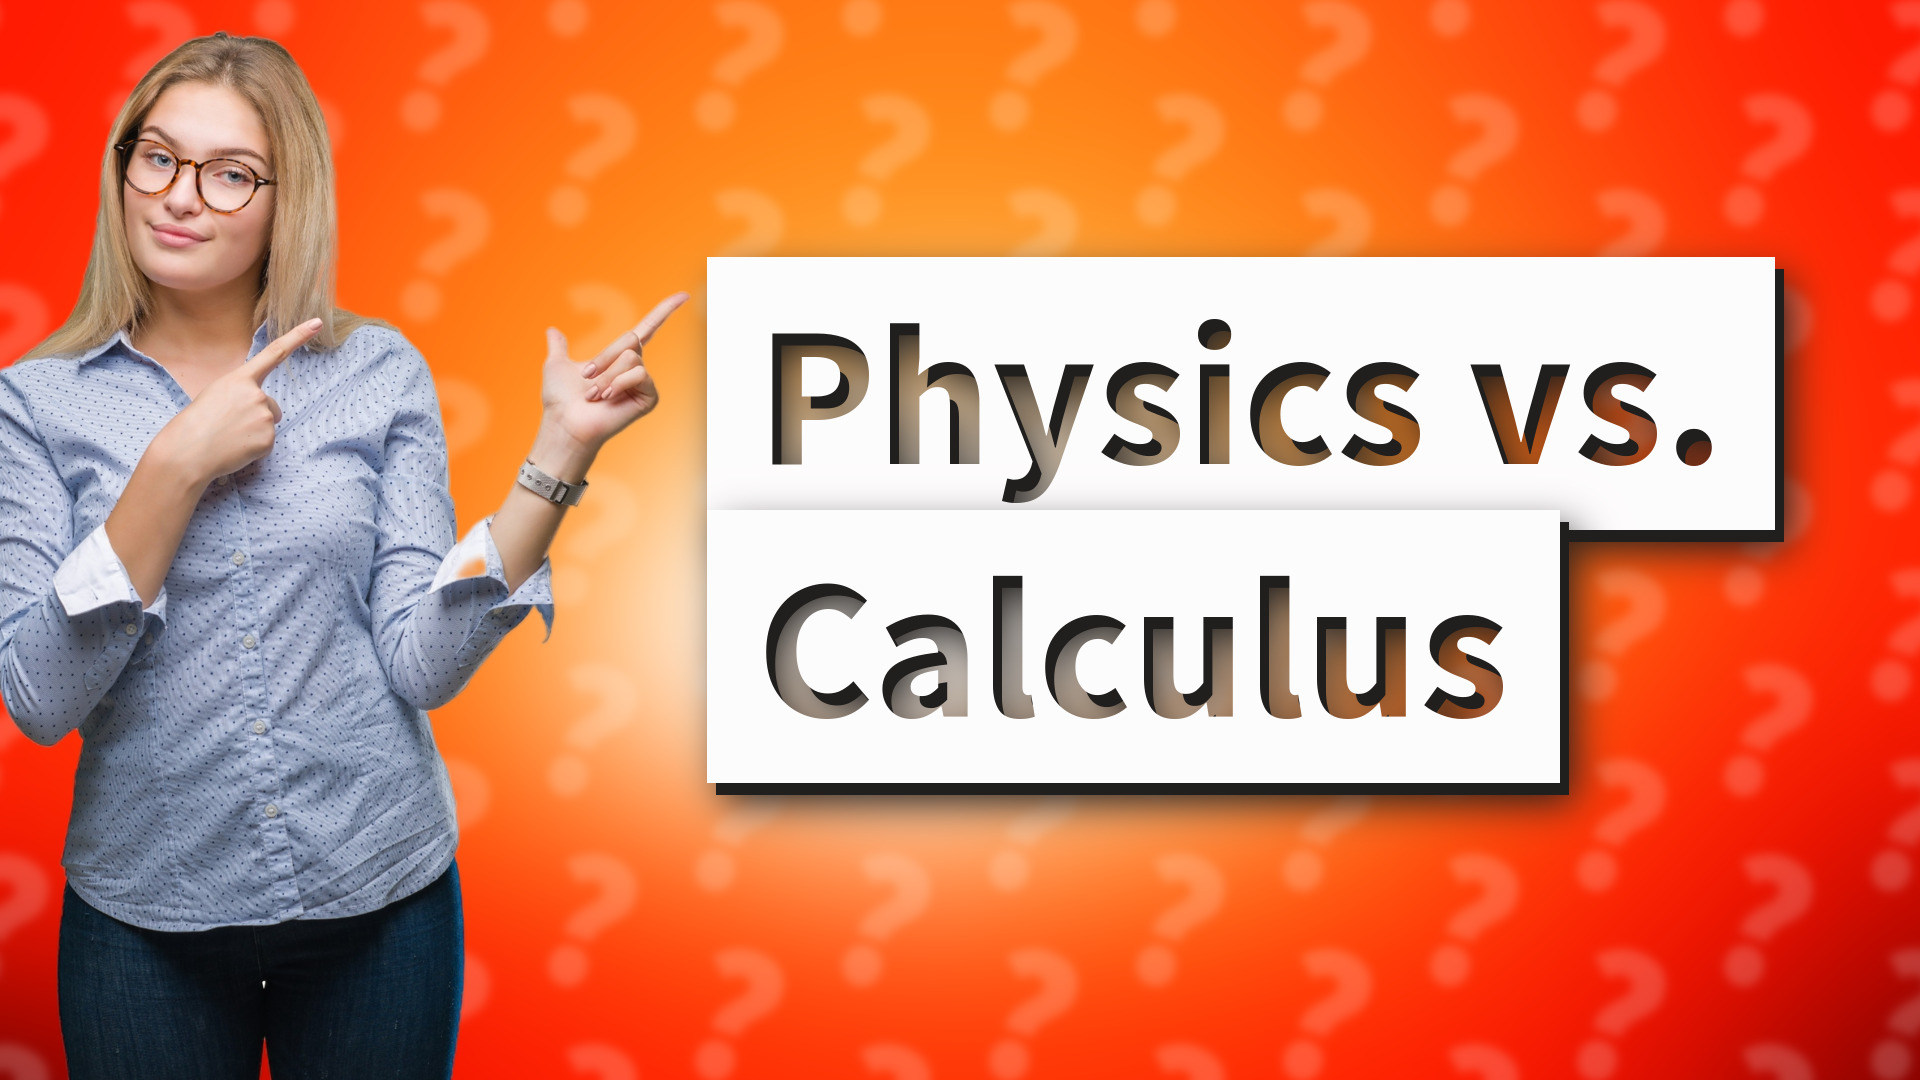
Explore whether physics or calculus is harder, considering the challenges and individual preferences involved in each subject.
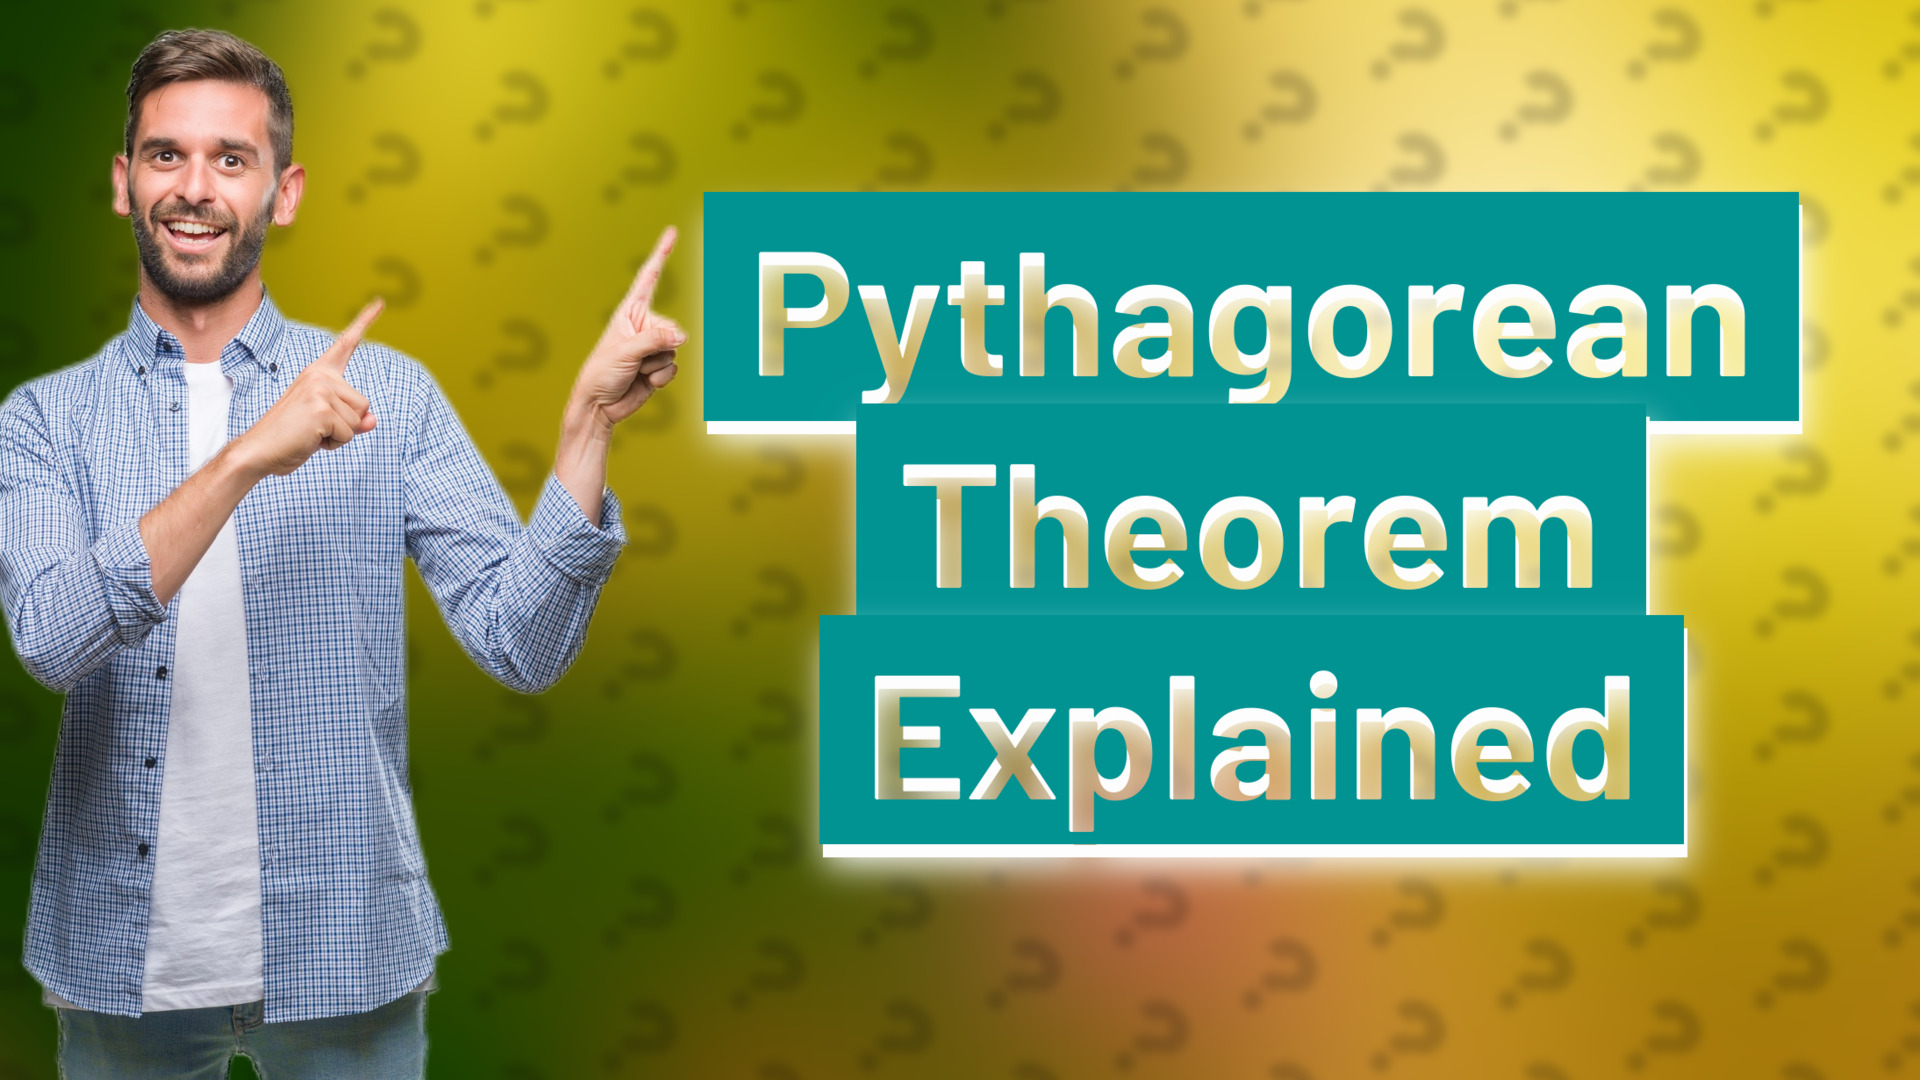
Learn what the side-side formula is and how to use the Pythagorean theorem to find missing sides in right-angled triangles.
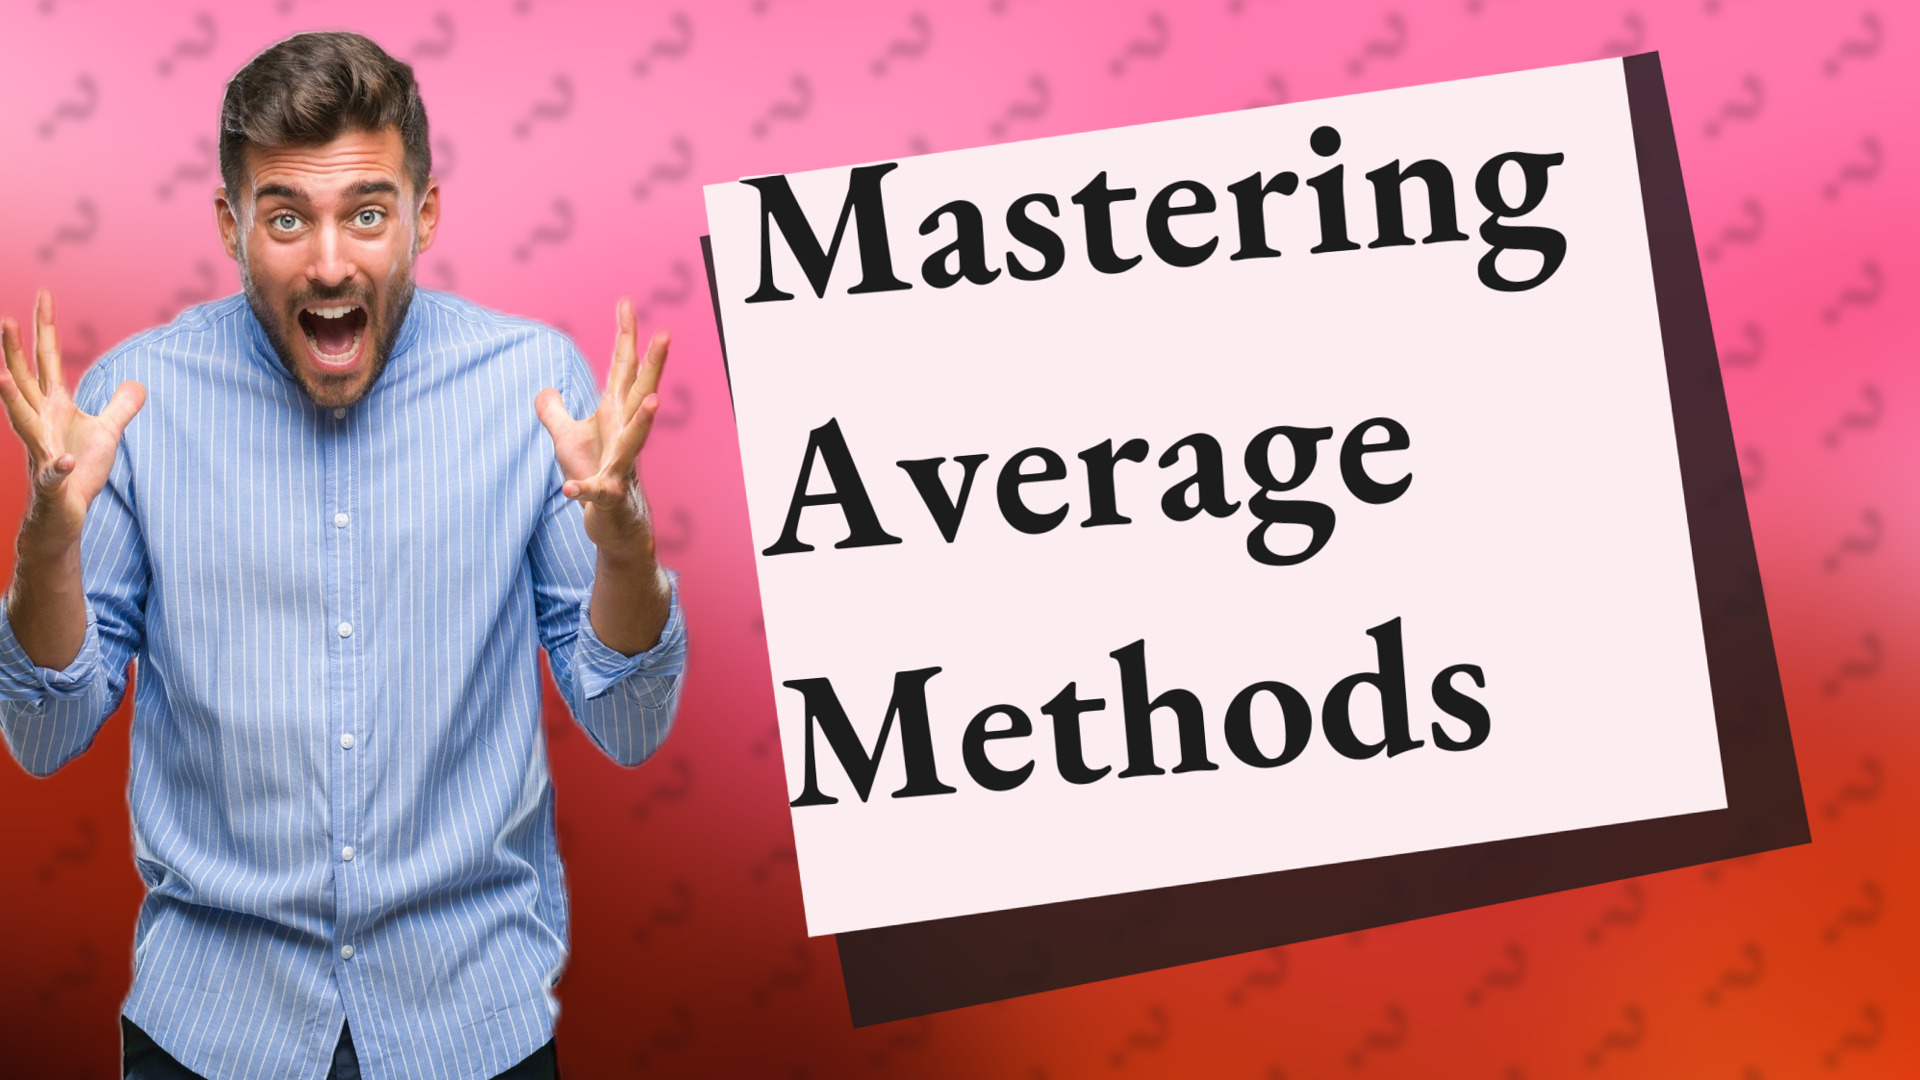
Explore the main methods for calculating average including mean, median, mode, and weighted average with clear examples.

Discover common places to find angles in everyday life, from buildings and furniture to art and utensils.
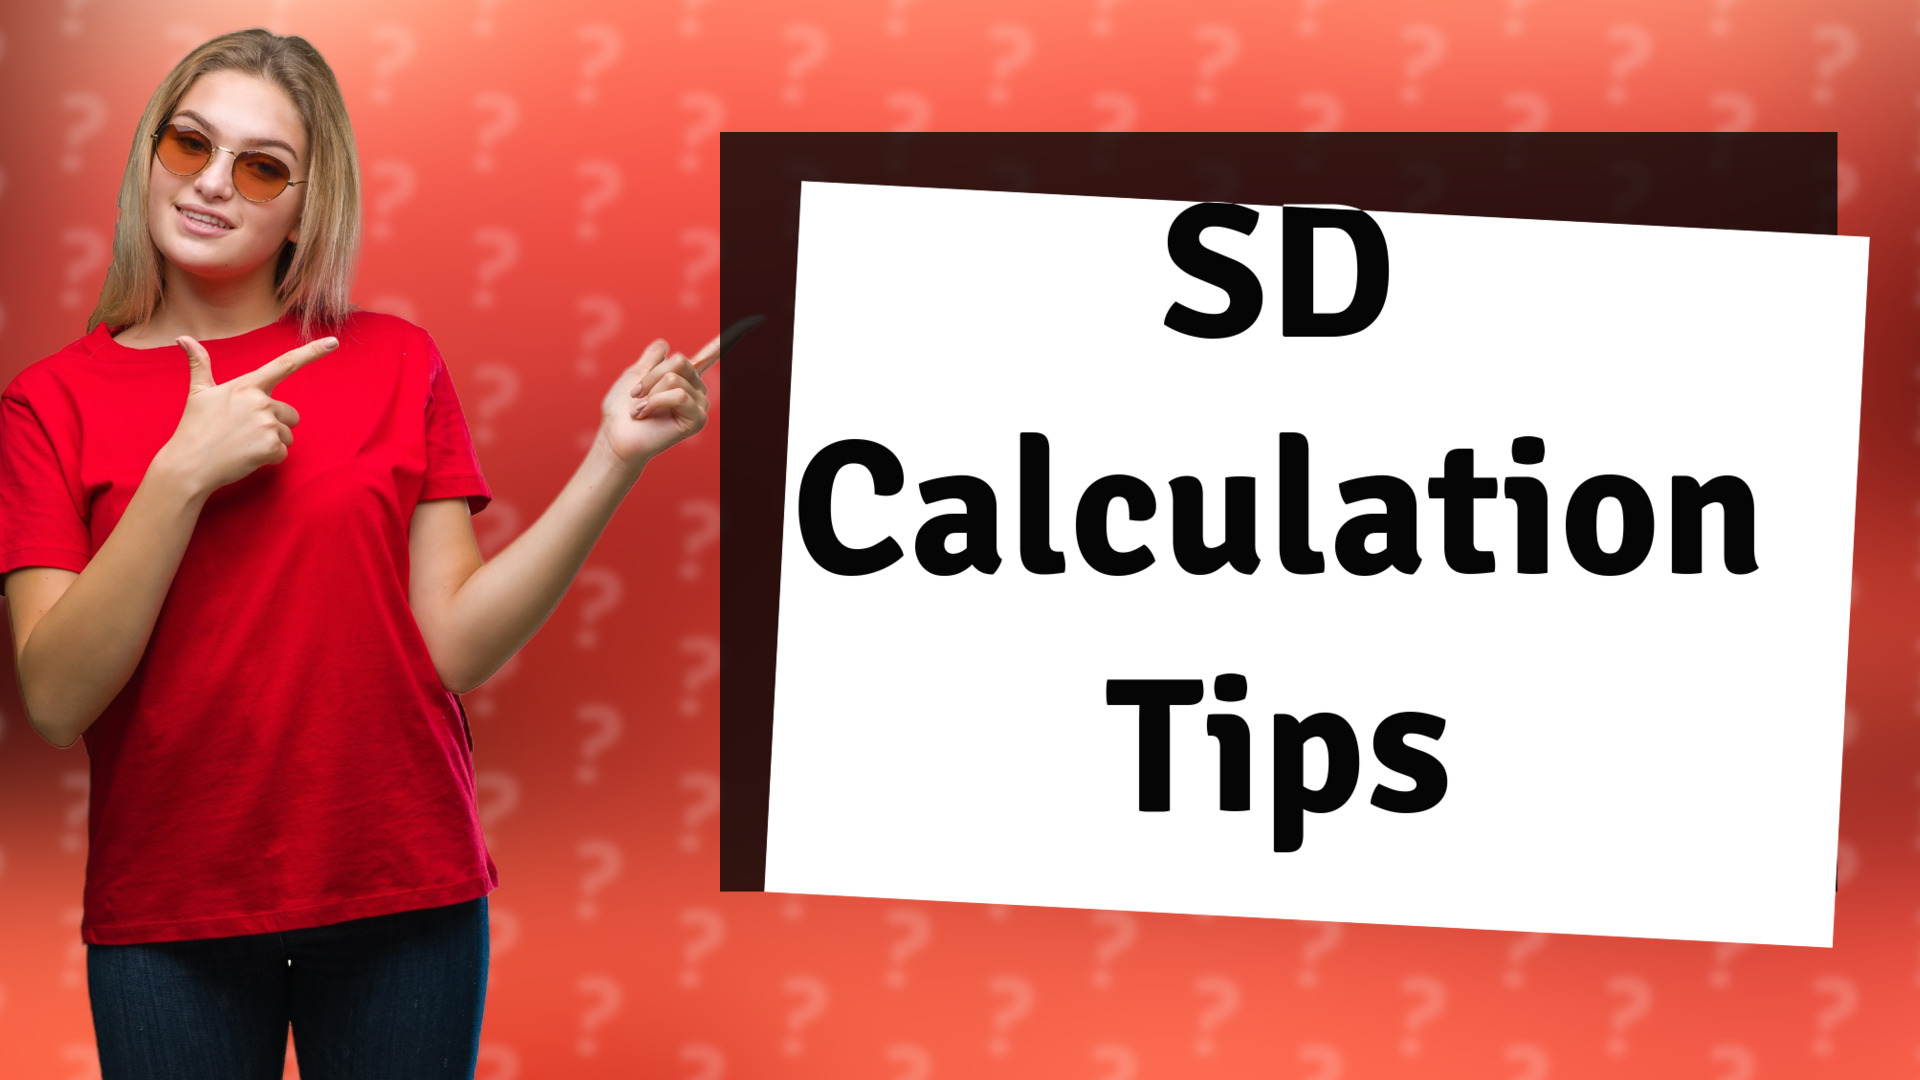
Learn the simple steps to calculate Standard Deviation (SD) and understand data spread in a dataset with this easy guide.

Learn why B1 is a higher language proficiency level than A2 and what skills each level represents.
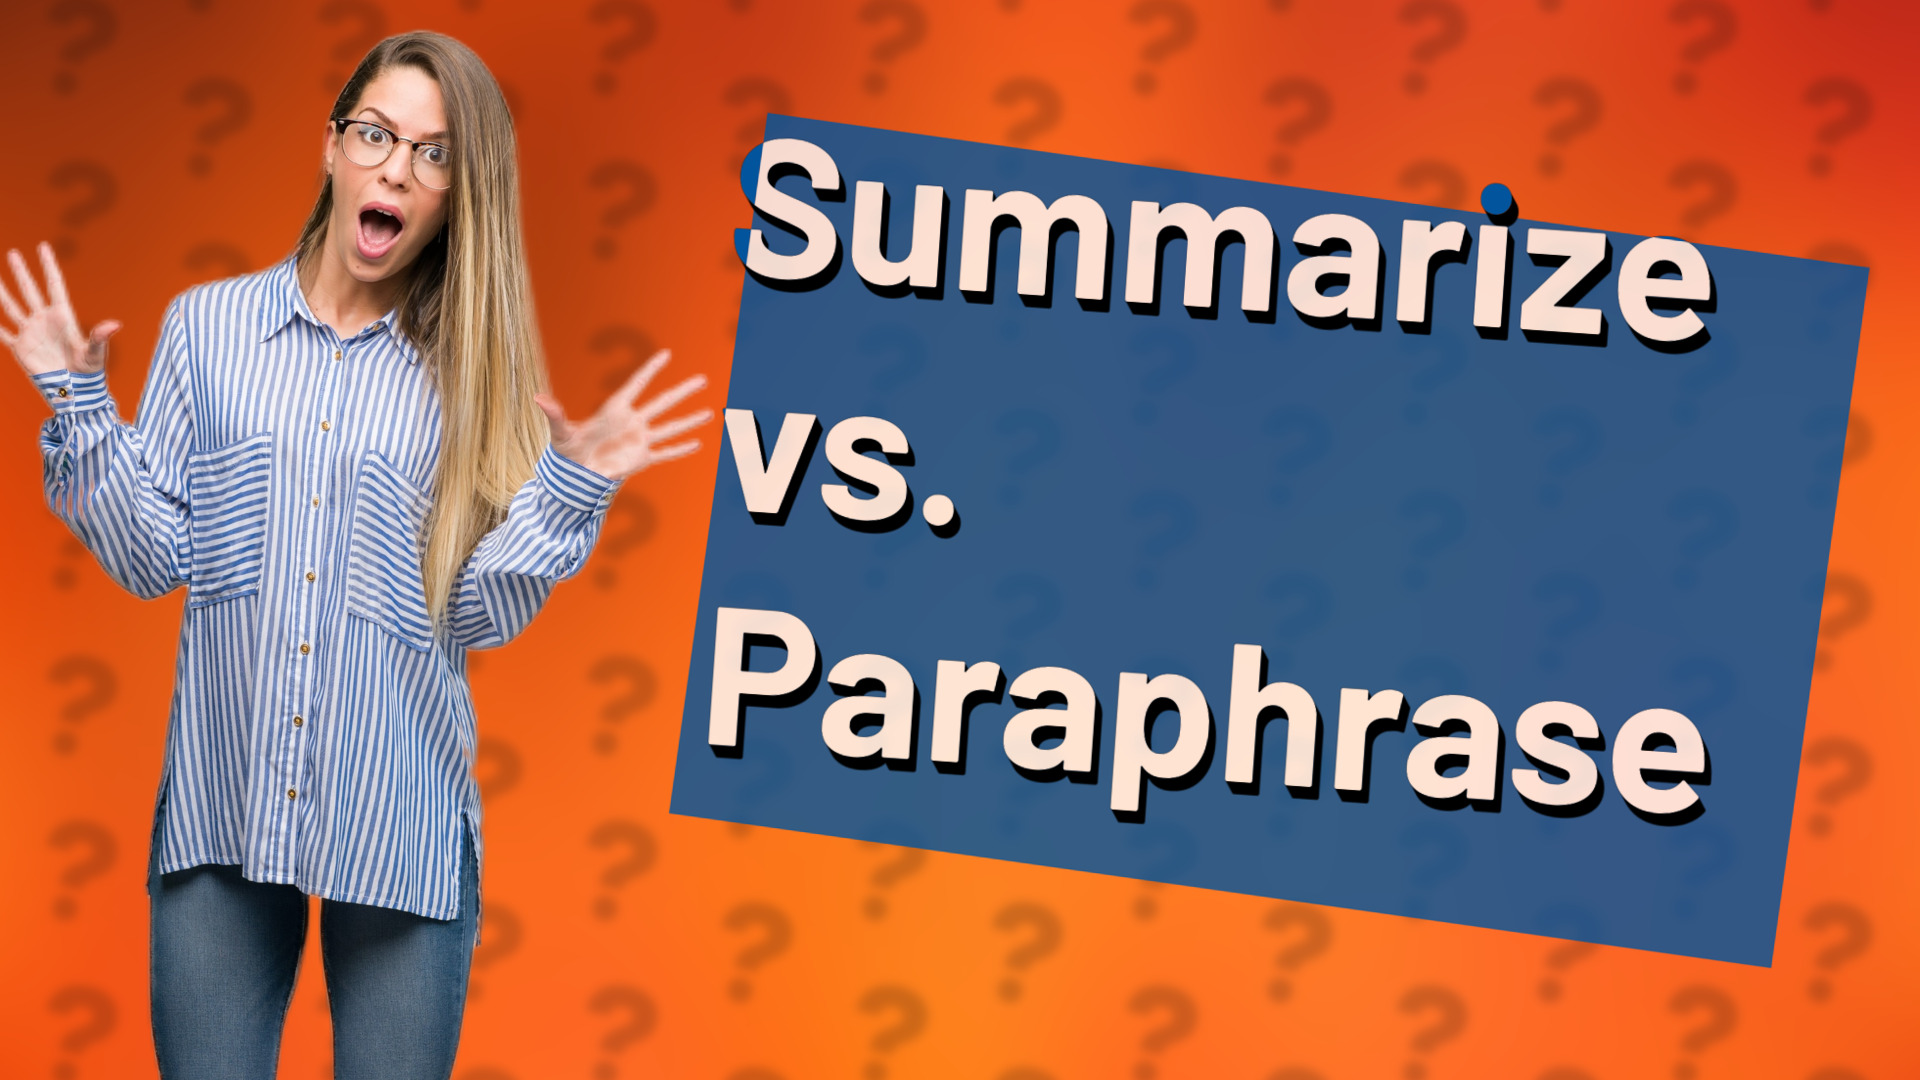
Learn how summarizing condenses text while paraphrasing rewords it, both essential for effective communication.

Learn what an attendance threshold is and why meeting it is essential for student and employee eligibility and certification.

Discover how Symbolab solves physics problems with step-by-step solutions for kinematics, dynamics, and more. Ideal for students and professionals.

Discover a step-by-step approach to learning accounting, from basics to advanced topics, including practical applications and continuous learning tips.

Learn about the four main vocabulary categories: receptive, productive, content, and function vocabulary to improve language skills.
Learn how to explain standard deviation easily with examples, helping students understand data variability and consistency.
Learn about Wisconsin ACT 143, a 2017 law enhancing school safety through mandatory drills, safety plan updates, and security grants.
Learn what standard deviation means and how it shows data variability using a simple example of test scores.

Discover the best accounting book for beginners: 'Accounting Made Simple' by Mike Piper, offering easy-to-understand financial basics and principles.

Discover why being good at math depends more on practice and mindset than a specific IQ score. Learn tips to excel in math today.

Learn about common categories like Food, Technology, Health, and more to help organize and find information efficiently.
Learn the key differences between predicate and predicate logic, and understand their roles in mathematical logic and reasoning.

Discover when connecting math concepts begins in school and how it builds a foundation for advanced math learning.

Discover the key units in Level 2 Health and Social Care, including Communication, Health and Safety, and Equality and Diversity for foundational knowledge.

Learn what a B paper means in academics, its grading significance, and what distinguishes it from other grades.
Learn how to read standard deviation to understand data variability and consistency with simple step-by-step calculations.

Learn the difference between sigma (standard deviation) and the mean in statistics. Discover how each measures data differently.

Learn what a slippery slope fallacy is with a clear example and understand why it’s a logical error in arguments.
Discover the meaning of A1, A2, and A3 levels or categories in education, technology, and more. Learn how to interpret these labels accurately.

Discover the main types of presentations including informative, persuasive, inspirational, instructional, and entertaining styles.

Learn what a printed access code is and how it provides access to online educational resources through physical textbooks.
Learn about the two main angular measurements—degrees and radians—and their uses in everyday life and advanced math.

Discover why the TI-84 Plus CE is considered the best calculator for all math tasks, featuring graphing, apps, and test acceptance.
Learn the difference between pro rata and average with clear examples on proportional distribution and calculating central values.

Learn about the 3-2-1 technique in summarizing: 3 key takeaways, 2 interesting facts, and 1 question to deepen understanding and retention.

Learn how to calculate the percentage of present and absent individuals using simple formulas for accurate attendance tracking.

Learn how to solve acceleration problems using the key formula and step-by-step method for physics beginners and students.

Learn how authors use clear explanations to inform, educate, and provide practical solutions to readers.

Learn how to find standard deviation in statistics with this simple step-by-step method to measure data dispersion effectively.

Learn how standard deviation applies in education by measuring variation in student test scores for tailored teaching approaches.

Learn the key to effective summarizing: identifying and conveying core ideas concisely without adding personal opinions.